How can we help?
New Feature Release Notes
Stay updated on the latest feature releases and find recordings of our
monthly release webinar.
Role Based Workflows
Organizes guides found within the help center based on how an end user is
most likely to use the platform.
User Guides
How-to guides, FAQs, and video tutorials.
Use Cases
Explore this section for videos focused on specific Use Case topics from
farm creation to prospecting using reports.
Feature of the Week
Short videos highlighting a single feature with links to relevant how-to
guides.
Promoted articles
April 2026 Release Webinar
April 2026 Release Webinar
Report Categories, Data Sources, and Use Cases
Report Categories, Data Sources, and Use Cases
Reports are broken down into four possible categories. Access to reports is based on your organization’s subscription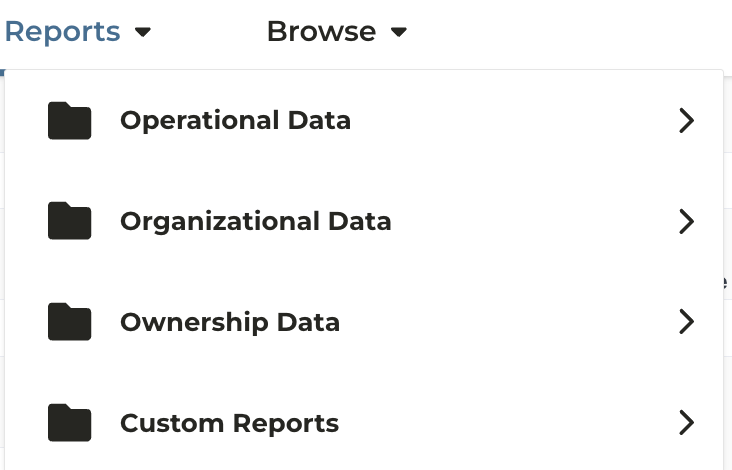
Operational Data
Reports in this category are driven by data sources centered around Operator/Farmer data*available to users with a Pro Subscription who have also purchased additional data integrations| Report Name | Data Source | Use Case |
|---|---|---|
| Operators* | DTN | - View all operator info provided by DTN - Matched to your CRM (if integrated) by address - Tip: Start your research using the report which allows you to hone in on information and link back to the map. |
| UCC Filings* | Fusable | - View all equipment UCC info provided by Fusable - Matched to your CRM (if integrated) by address - Tip: Start your research using the report which allows you to hone in on information and link back to the map. |
| USDA Subsidy Payments | FSA | - View USDA subsidy payment amounts and payee data - Tip: Start your research using the report which allows you to hone in on information and link back to the map. |
| Market Share Details | Organization Contacts | - Instantly view your customers vs. largest operator prospects |
| Market Wallet Share | Organizational Data Share | |
| Total Addressable Market | Organizational Data Share |
Organizational Data
Reports in this category are driven by users within your organization or data your organization sends directly to CamoAg*reports outlined in orange are available to users with a Basic subscription, remaining reports require a Pro subscription and may also require additional integrations| Report Name | Data Source | Use Case |
|---|---|---|
| AgWare Data* | AgWare | - Requires an integration with Agware |
| CMAs Created | Org Users | - View total number of Comparative Market Analyses (CMA) created within the organization or by a specific user - High level details of the subject farms such as county location and acre types - CMA value vs. soil rating - CMA value as compared to property size - Compare values over time if multiple CMAs have been created for a farm |
| Comps Created | Org Users | - View the sales data shared by your organization and/or the number or private comparable sales created across the organization or by a specific user - Correlation between Sale Price vs. Soil Rating or size - Graphical view of sale prices over a given time farm - Report can be accessed from the map for enterprise accounts sending sales data directly to CamoAg |
| Contacts - Pro* | Organization CRM | - View your CRM contacts, their products, relationship manager, and contact information - Report can be accessed from the map |
| Documents | Org Users | - View all documents uploaded to a farm including documents assigned an expiration date - Sort documents by Category and Subcategory (if assigned) |
| Farms, Fields, and Parcels | Org Users | - View total number of farms created within the organization or by user - Understand total acres associated with an Owner/Entity, Portfolio, or County - represented with a graph and table - View a breakdown of farms by acre types such as Irrigated, Dryland, CRP, Etc. |
| User Engagement Summary* | Org Users | - Understand how users in your organization are using the CamoAg platform |
Ownership Data
Reports are driven by data sources centered around parcel ownership*require a Pro subscription and may require additional integrations| Report Name | Data Source | Use Case |
|---|---|---|
| Land Sales Bulletin Data | Land Sales Bulletin | - View a heat map of Land Sales Bulletin data in your subscribed states to understand what counties or areas have a high or low concentration of sales - Use filters to hone in on sales data for one or more counties and download the table to further run your own comparisons |
| Largest Farmland Buyers & Sellers | Farm Sales | - Create marketing lists - Understand who is purchasing the most land in a certain area |
| Mortgages Pro* | Cotality Attom** | - View all mortgage info provided by Cotality and matched to parcels in CamoAg using Parcel IDs and county recorder documents. - Attom Mortgage data will be visible on the map regardless of purchase, but only available in the reports if purchased by your organization. - Matched to your CRM (if integrated) by address - Report can be accessed from the map or from the reports menu |
| Owners Pro* | Regrid/Attom | - View all Owner info matched by CamoAg - Matched to your CRM (if integrated) by address - Create marketing lists with addresses - Report can be accessed from the map or from the reports menu |
| Recently Created Auctions | CamoAg | - View auctions entered into the platform by CamoAg and gathered from various auction sites |
Custom Reports
Custom reports are built by your organization using CamoAg data and integrations. Contact your account team for access and setup details.Navigating the Operation Profile
Navigating the Operation Profile
CamoAg Operator Map Layer
CamoAg Operator Map Layer
Available to Organizations with a Pro SubscriptionCamoAg classifies agricultural producers into operational size categories using publicly available subsidy payment data. Based on 2021 payment records, operations are segmented into defined acreage buckets to estimate scale. Producers whose subsidy payments reach the maximum allowable threshold are categorized within the 10,000+ acre segment, as payment caps introduce limitations in determining precise operation size at the upper end of the distribution.What are the acre buckets?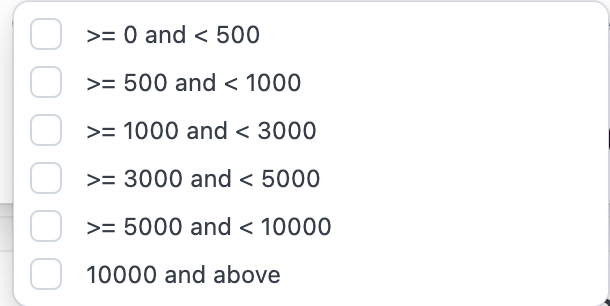 What if the acres displayed are inaccurate, can my organization correct them?
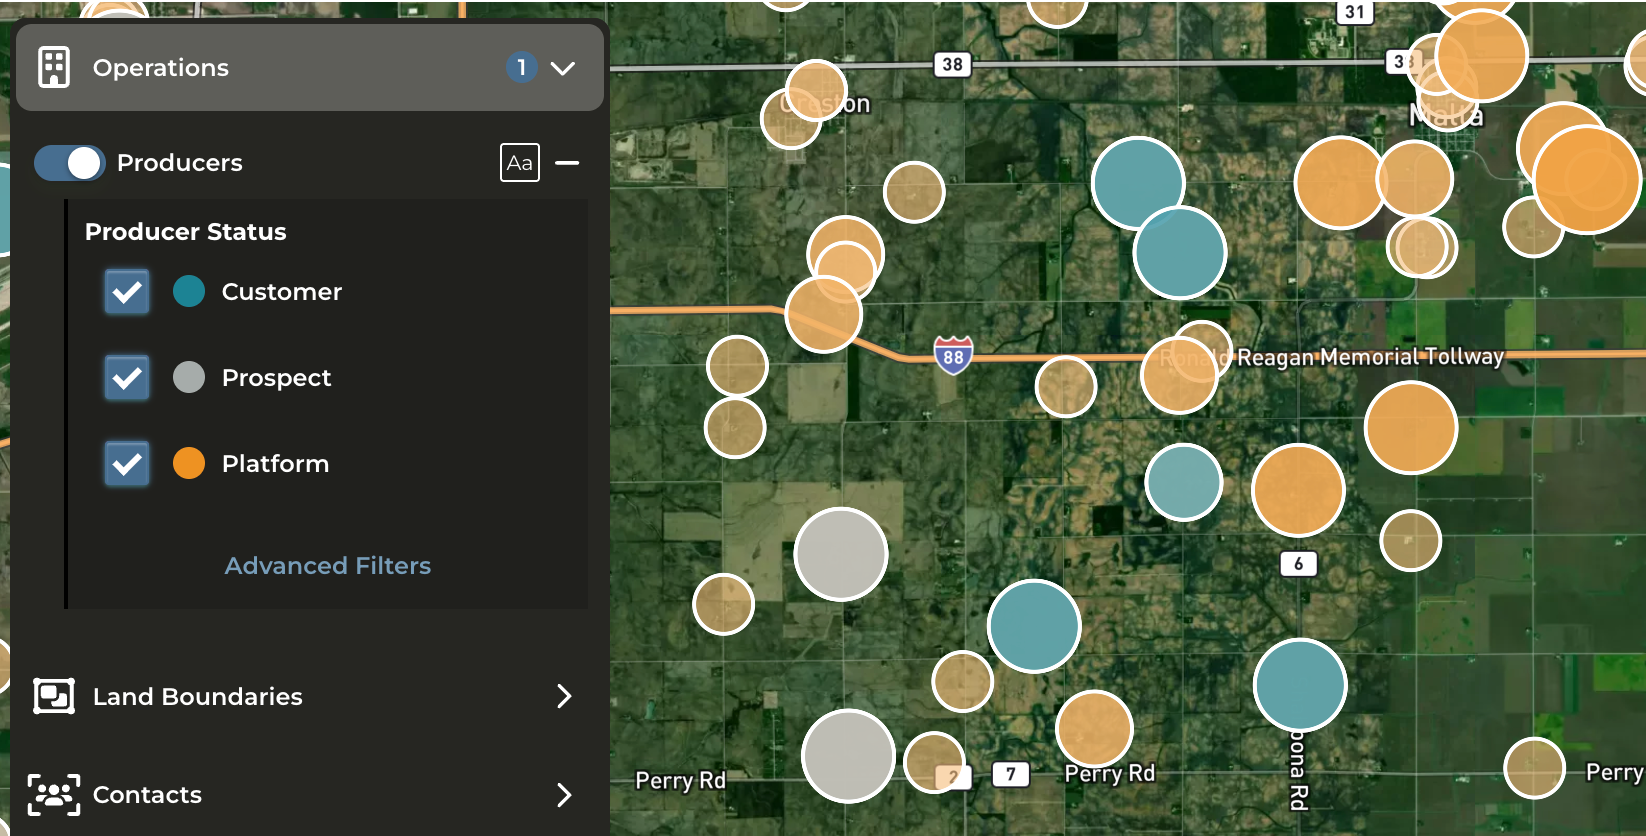 Can I filter the operators on the map?
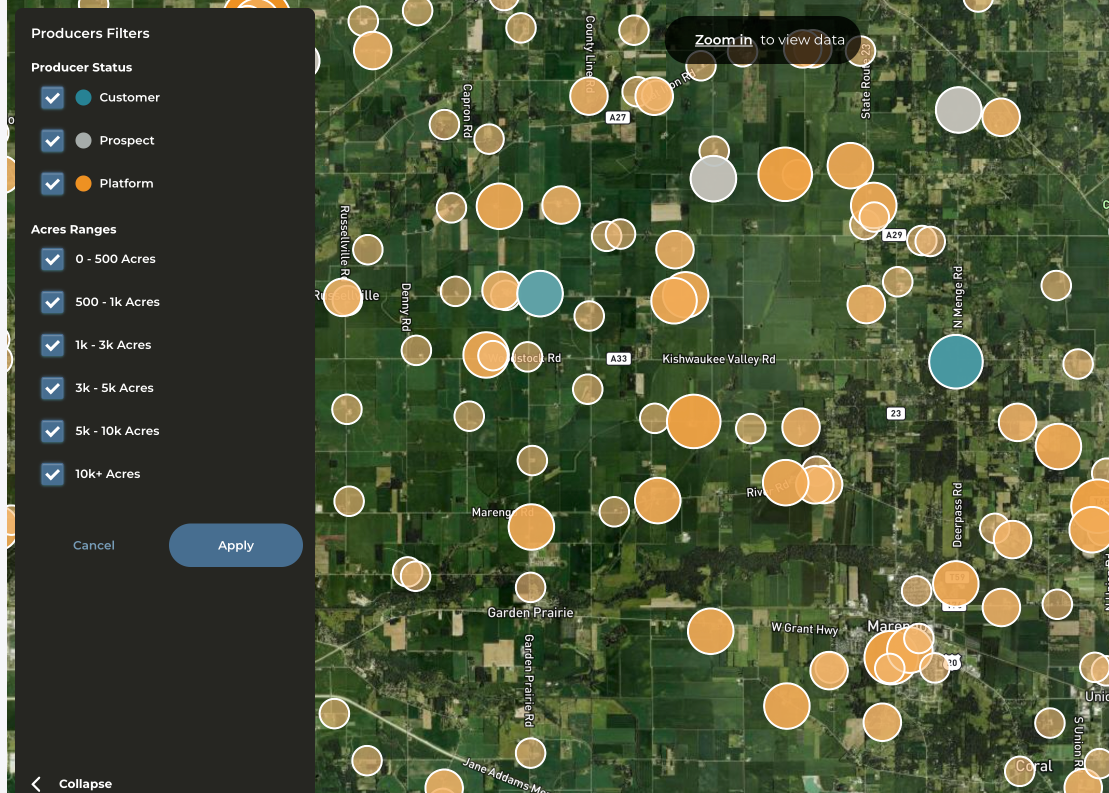
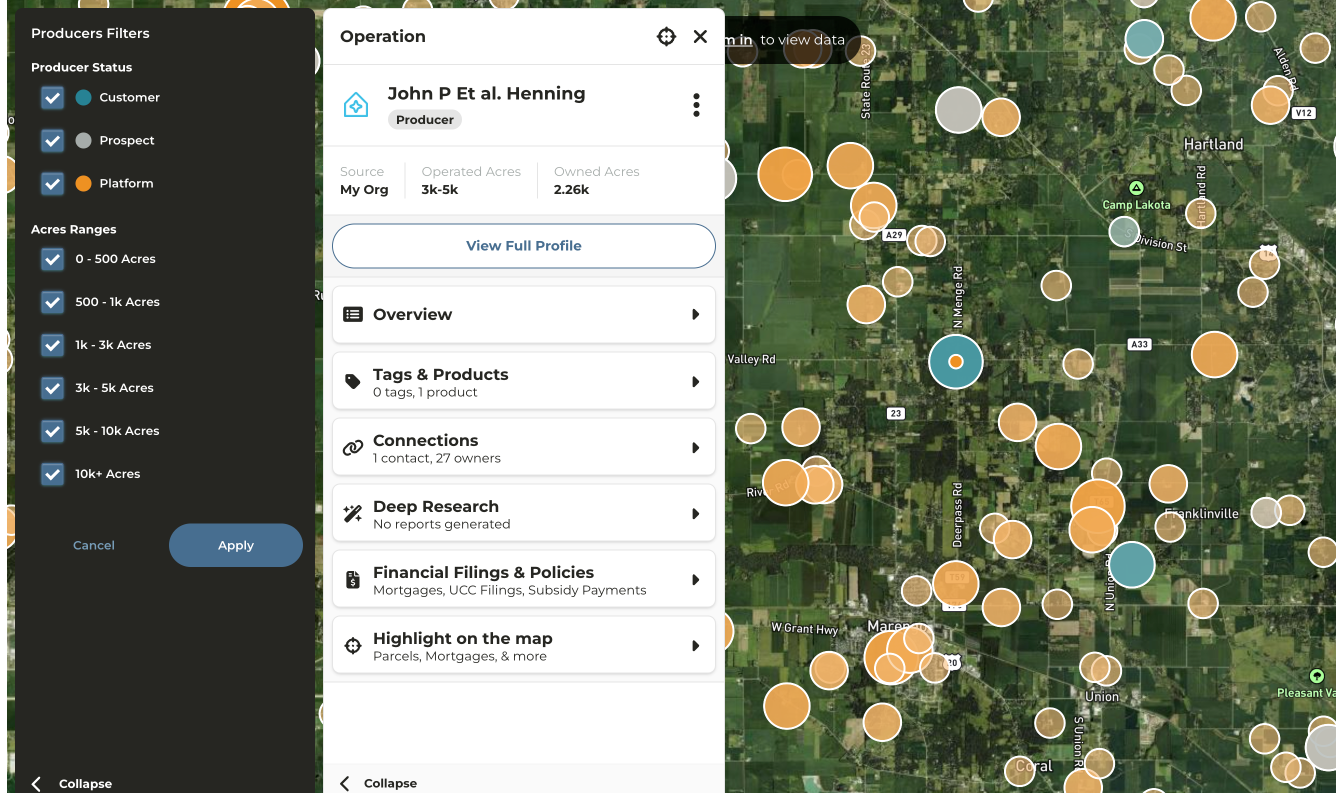
- Users with Organization Admin privileges can make edits to operator acre amounts as long as the operator is a contact. Editing Estimated Operator Acres
- Contacts can be created directly in CamoAg or may be ingested directly from your organizations CRM integration
- When a third-party data provider is configured for your organization, any manual edits to acreage values at the contact level will take precedence over provider-supplied data. The organization-entered acreage will be reflected on the map display and applied as the Estimated Acres value within applicable report filters, including the UCC Blanket Liens and Owners reports.
- The larger the circle, the larger the operator
- If your CRM is integrated or you have created contacts in CamoAg the icon coloring is consistent with the contacts layer
- Teal/Blue = Customer
- Gray = Prospect
- Orange = No relationship/not a contact
- Yes. Click on Advanced Filters to filter by status and acreage buckets.
- Click on the circle that matches up with the operator for which you want to see more information
- Operator profile will appear in the panel on the left side of your screen
- Click on any category to expose additional details such as Connections
- Click on View Profile to be taken to a more detailed and in depth analysis of the operation
AI-Powered Deep Research
AI-Powered Deep Research
Requires Pro SubscriptionImportant: A deep research report can be run for both a public and private network.AI-Powered Deep Research delivers a comprehensive, professionally formatted PDF report for a contact or network. Each report provides rich insights, including farmland holdings, estimated operation size, potential affiliates, agricultural practices, associated individuals, and verified address information.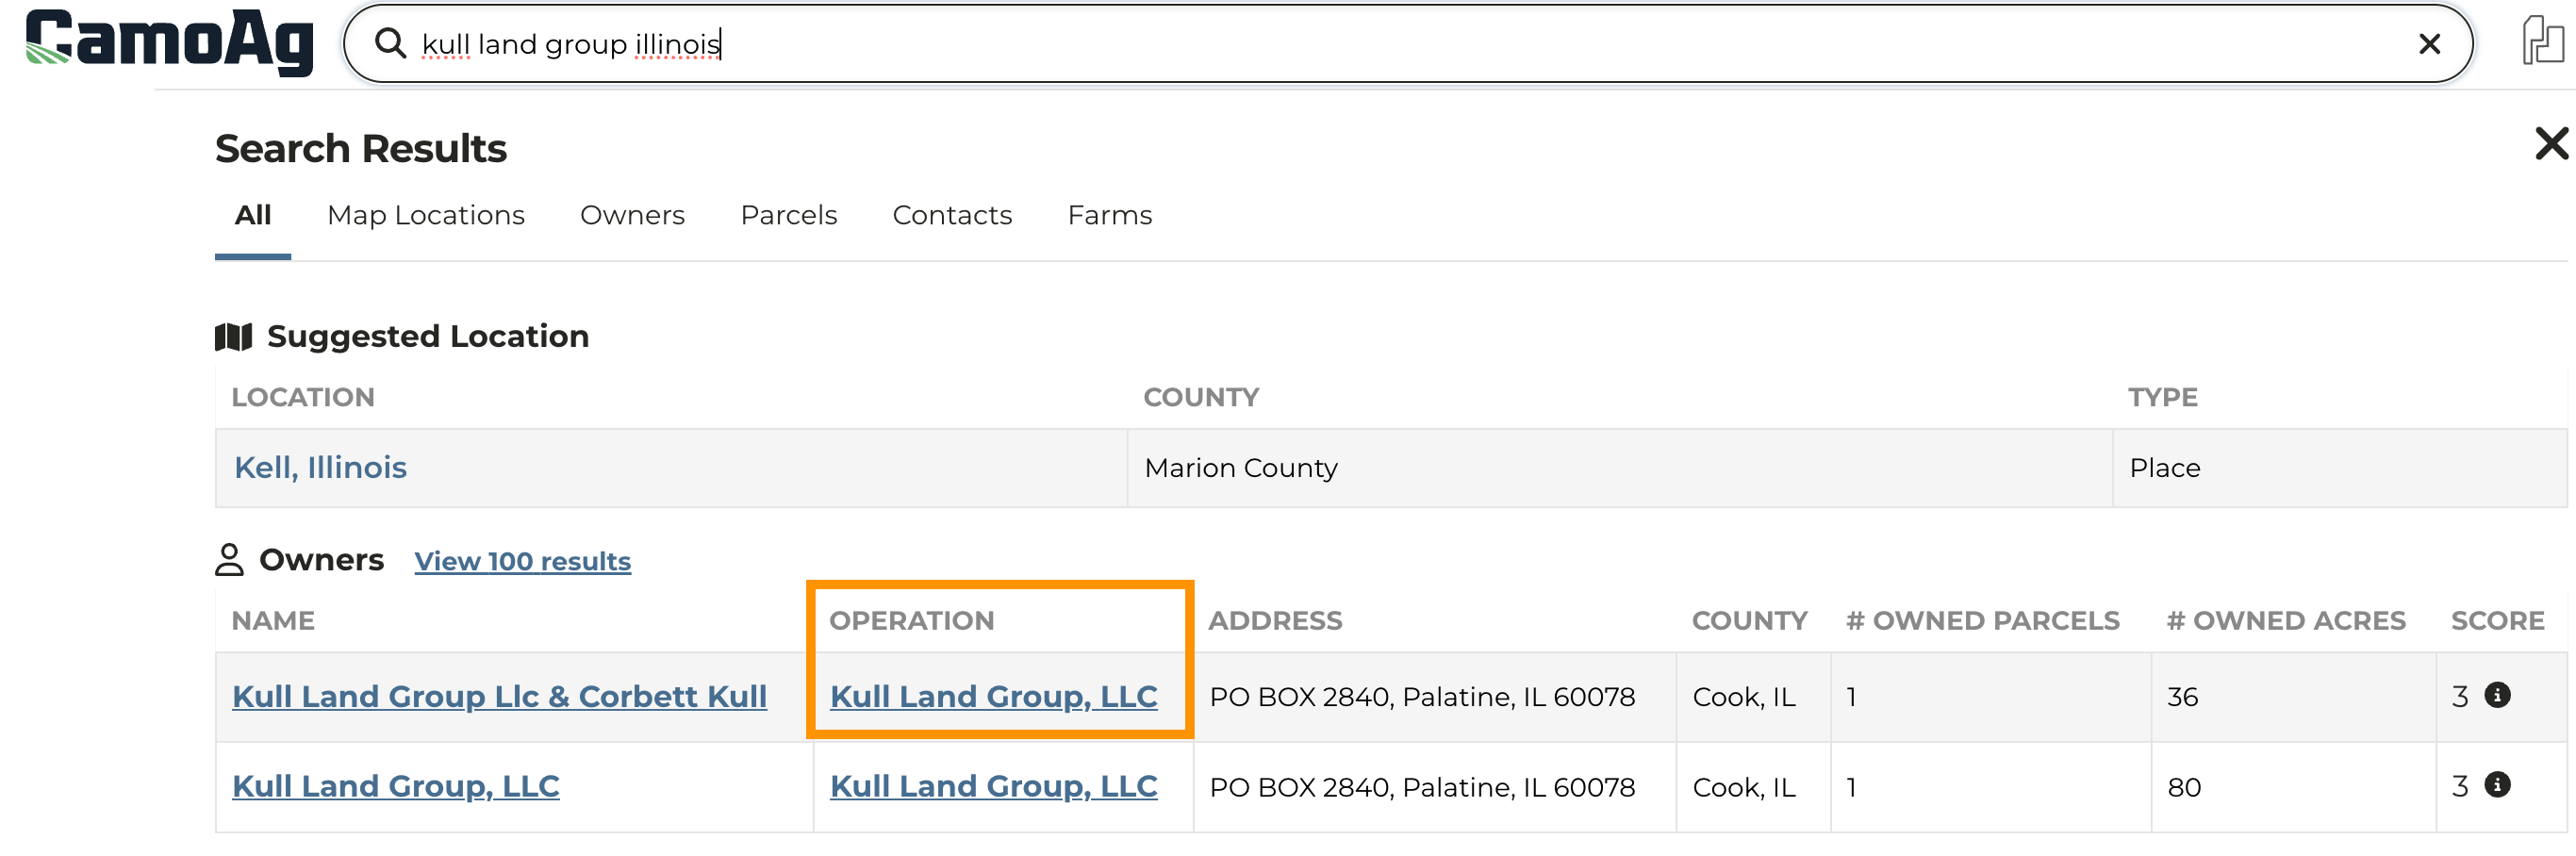
- Operation Mapping: Uncovering the relationships between individuals and legal entities within a farming operation.
- Diversified Business Ventures: Revealing related non-agricultural business interests, like laundromats or car washes, with clear citations.
- Financial and Legal Context: Identifying entity structures and mentions of relevant documents for further analysis
- Reports in Minutes Not Hours: Faster time-to-insight and can execute market briefs, customer profiles, and even compliance checks with confidence.
Locating & Running a Deep Research Report Using Smart Search
- Enter the name of the entity into Smart Search
- On the results page name click on the entity under the Operation column
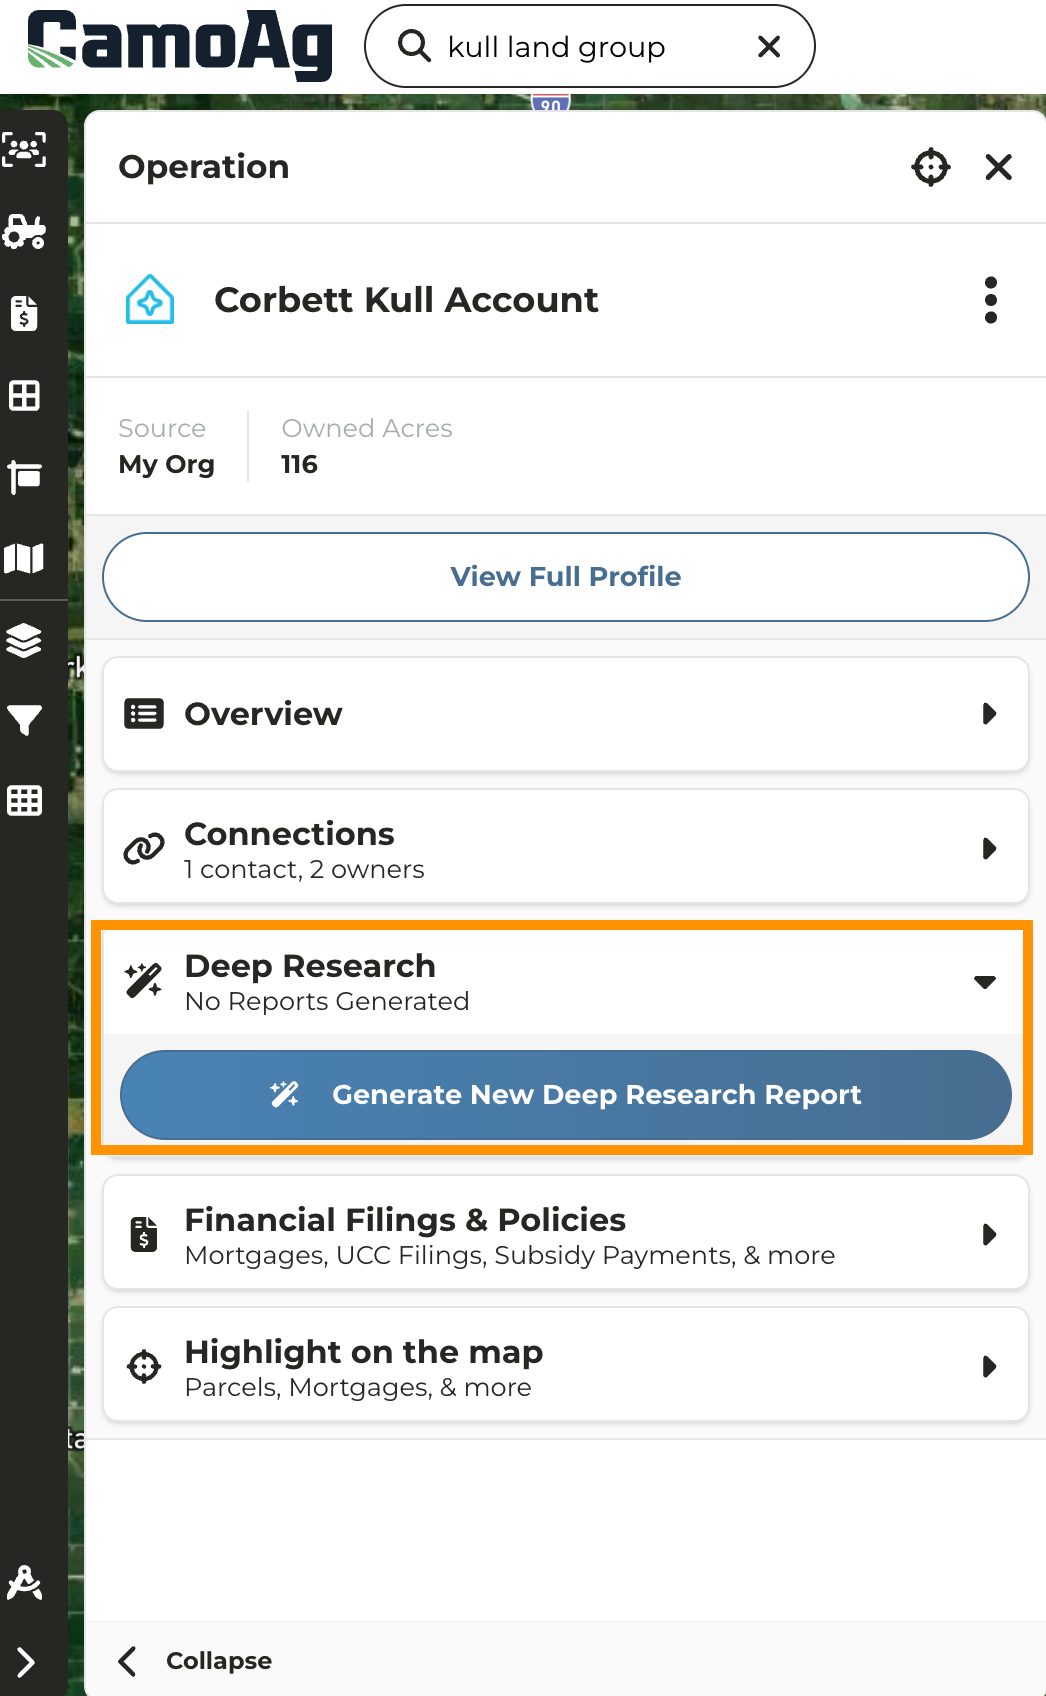
- On the information panel click the Deep Research category to expand then click Generate New Deep Research Report
- The report may take a couple minutes to generate. Once generated a notification will appear at the bottom left of your screen.
- Reports will be saved with the entity and accessible to other users
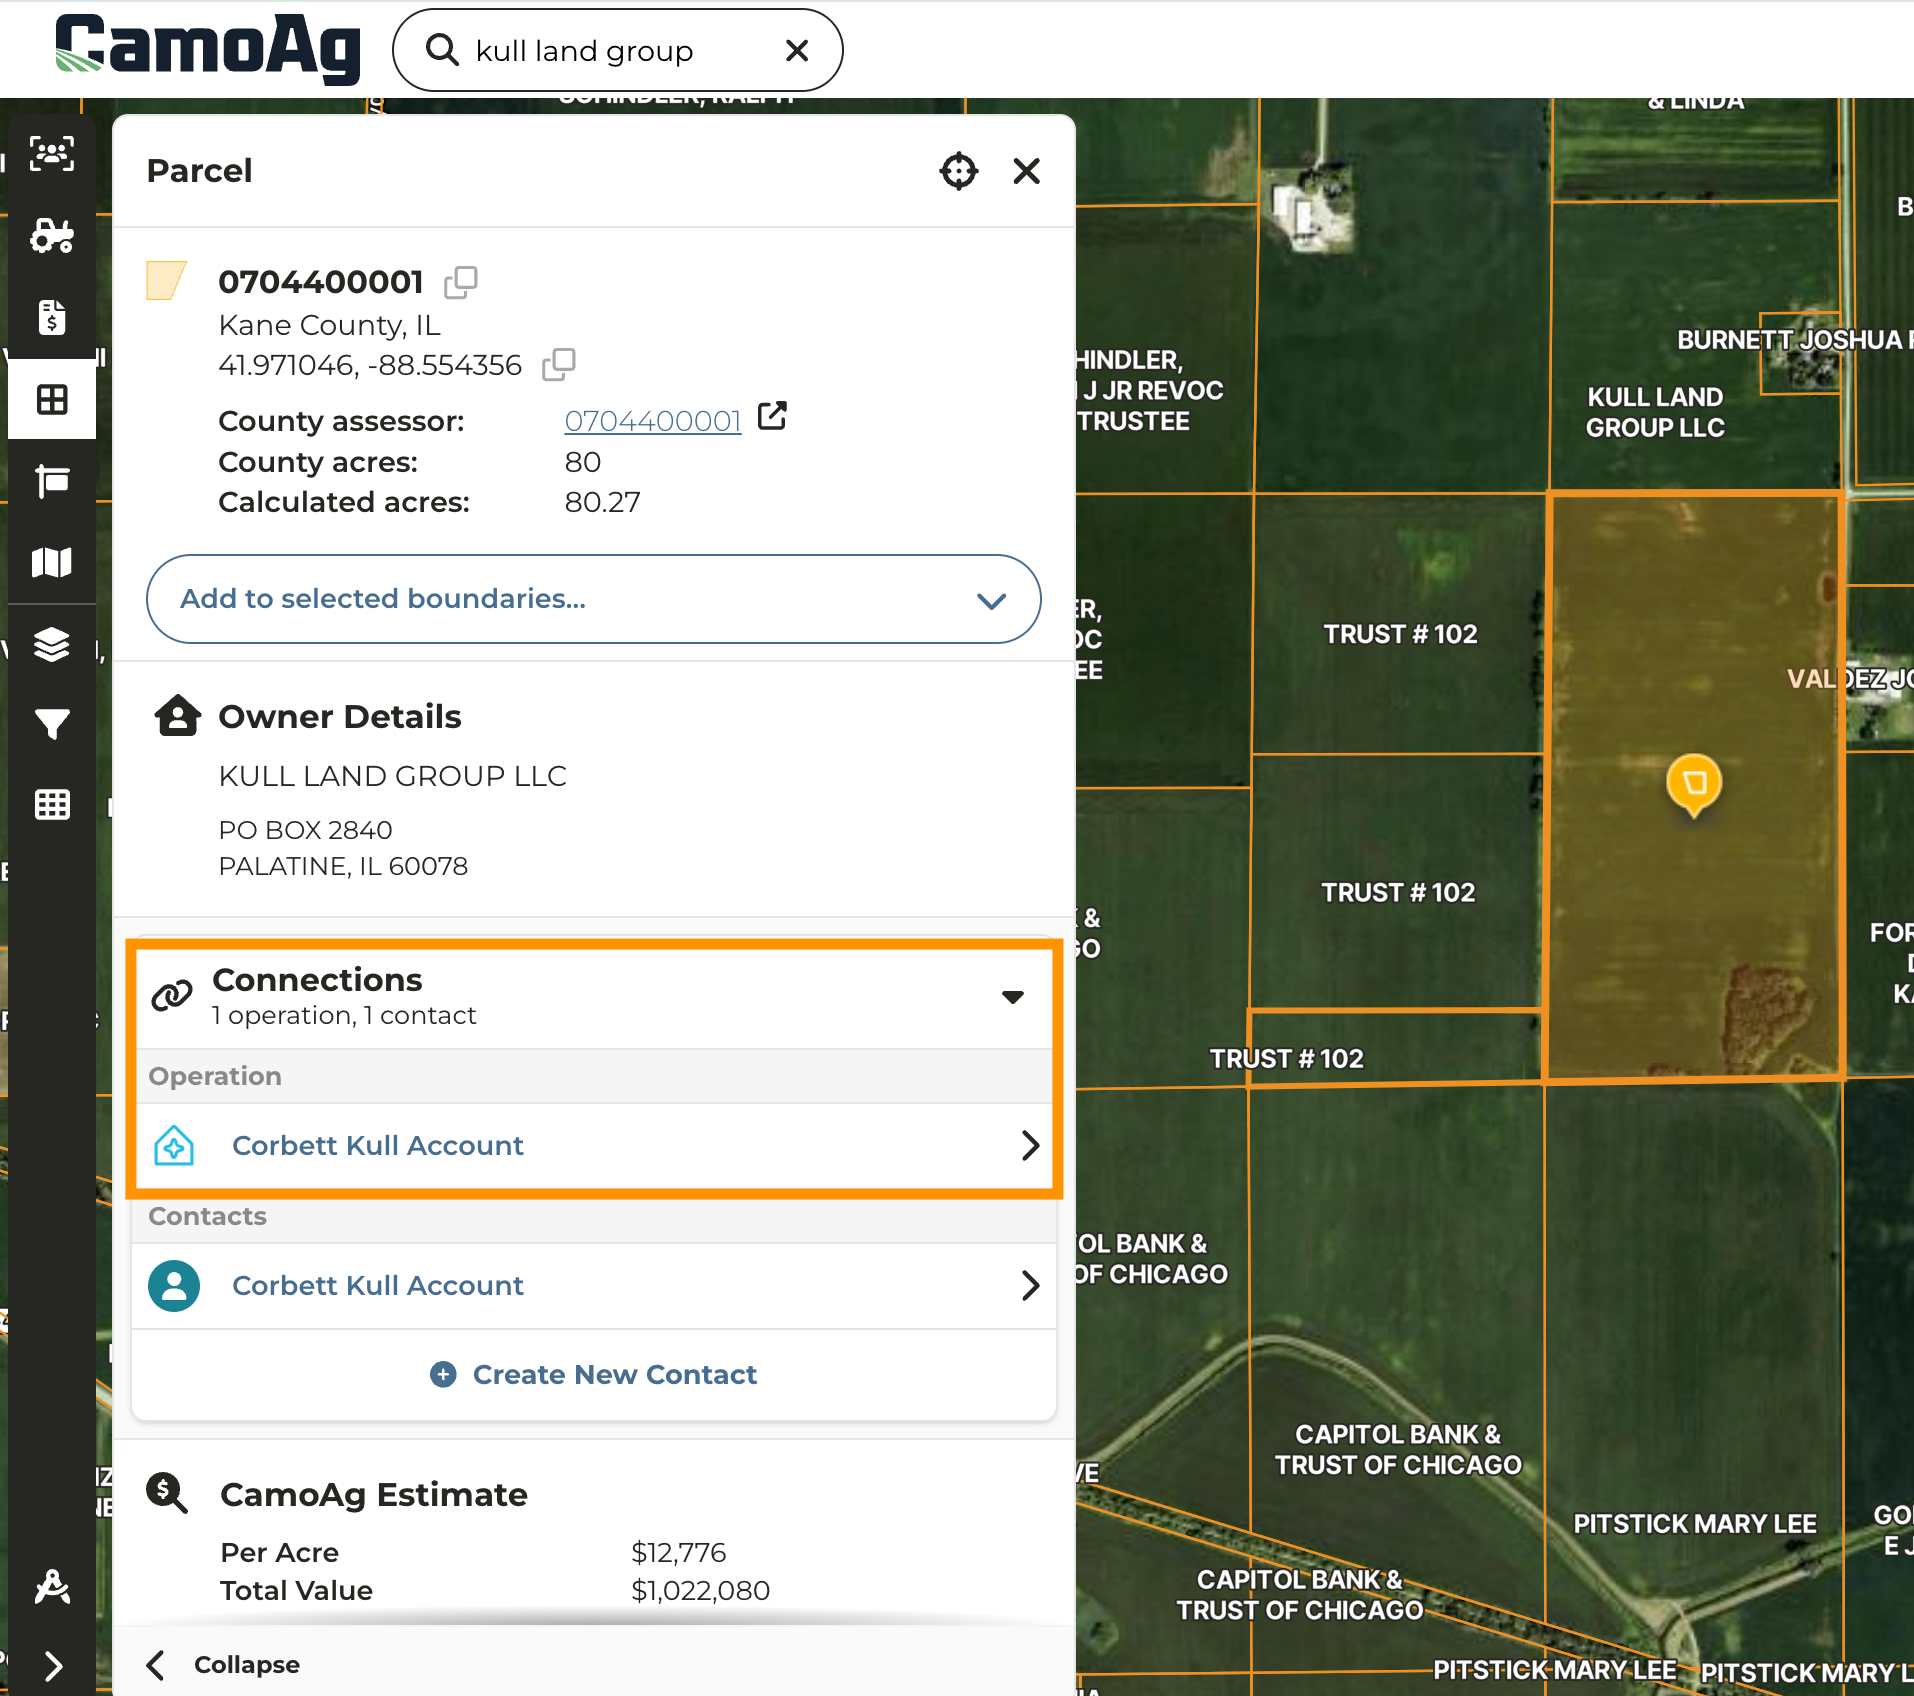
Locating & Running Deep Research Reports for an Operation From the Map
- Navigate to the Map and click on the parcel of the entity for which you want to run a report
- Under Connections click on the Operation
- On the information panel click the Deep Research category to expand then click Generate New Deep Research Report
- The report may take a couple minutes to generate. Once generated a notification will appear at the bottom left of your screen.
- Reports will be saved with the entity and accessible to other users
Support Information
Feature Release Webinar
Register for 2025 now!
Support Hours
8:00am - 5:00pm CST Monday to Friday
Support Information
Feature Release Webinar
Register for 2026 now!
Support Hours
8:00am - 5:00pm CST Monday to Friday