> ## Documentation Index
> Fetch the complete documentation index at: https://docs.camo.ag/llms.txt
> Use this file to discover all available pages before exploring further.
# User Engagement Report
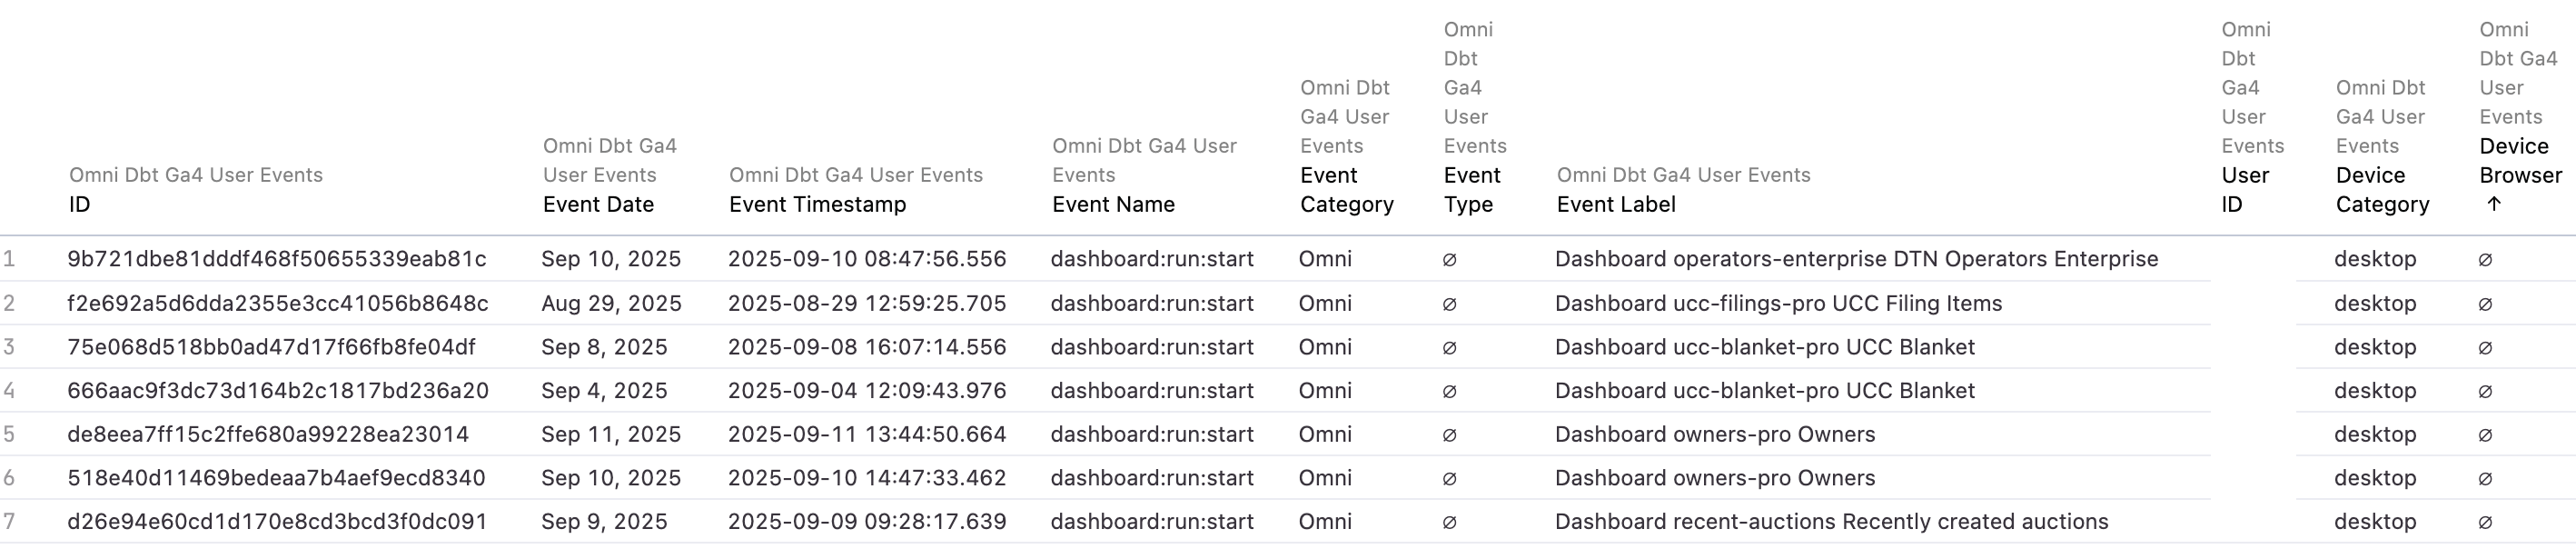
Click on the number or bar graph event to **Drill into Total Events**
* View how users are accessing the platform such as desktop or mobile
* Event dates and times
* Reports accessed and more
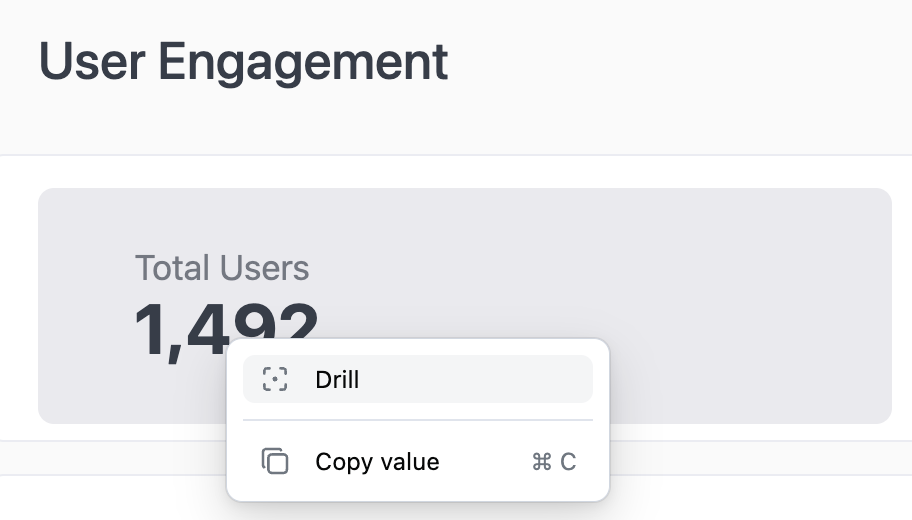
**Total Users:** Number of users that have logged in within the time frame set with the **Event Date** filter. By default, the last 30 days are displayed.
**Total Dashboard Starts:** Number of events that have started from the Dashboard. For example, user accessed a report while on the Dashboard vs. while on the Map
**Total Pageviews:** Total number of pageviews by users who have logged in to CamoAg within the designated time frame.
**Pageviews by Users - Top 10:** Who are the top 10 users of the platform
**Dashboard Starts by User - Top 10 -**
**Pagviews by Page Path -** Understand where users are navigating to in the platform the most.
**Dashboard Starts by Dashboard - Top 10 -** What pages or reports are users clicking to from the Dashboard?
**Unique Users by Week:** Visualization of how many unique users are logging in each week.
**Total Page Views by User:** List of all users and total number of events vs. only the Top 10