> ## Documentation Index
> Fetch the complete documentation index at: https://docs.camo.ag/llms.txt
> Use this file to discover all available pages before exploring further.
# Generating a Report from a Custom Features of Interest Layers
* Barn & Equipment Storage
* Gate Access
* Grain Bin
* Other
* Wells & Pumps
* Wind Turbine
***The available reports will be based on your organization's subscription and data integrations***
* Potential available reports may include:
* **Comps Created:** Will display sales sent to CamoAg from your organization, within the boundaries of the layer selected
* **Contacts Pro:** Report will display CRM contacts whose address is located within the boundaries of the layer selected
* **DTN Operators Pro**
* **Land Sales Bulletin**
* **Largest Farmland Buyers & Sellers**
* **Mortgages Pro:** Report will display mortgages within the boundaries of the layer selected
* **Operators Pro:**
* **Owners Pro:** Report will display entities who own property within the boundary selected. Note the owner does not necessarily have to live within the boundary.
* **Recently Created Auctions**
* **UCC Blanket Report**
* **UCC Filing Items Pro**
* **USDA Subsidy Payments Pro**
* The data that pulls in will be based on the boundaries of the layer applied. For example, if your organization has a layer based on lending regions, by clicking on a specific region then running the report, the data pulled in will be based on the boundaries of the selected region.
* Right-click will always pull in data based on a radius from the point of click
Navigate to the Map
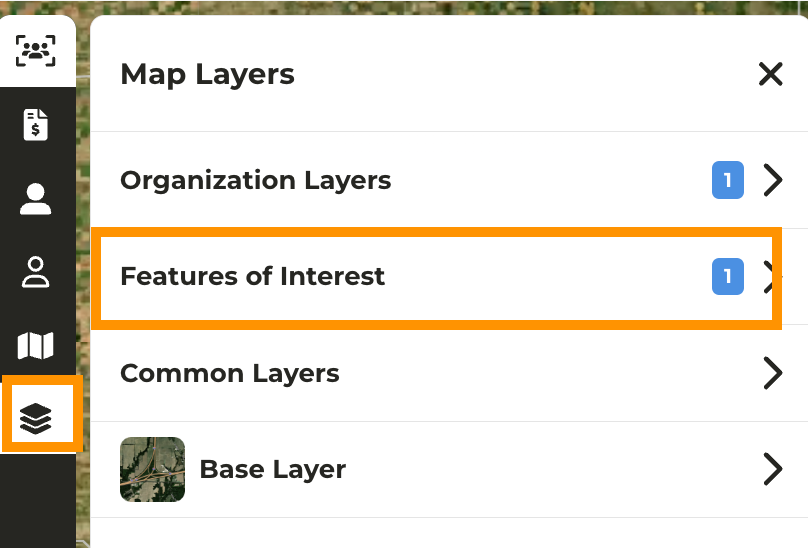
Click on **Layers** then **Features of Interest**
Enable the layer you want to work with *(for this example we are using the KS Groundwater districts)*
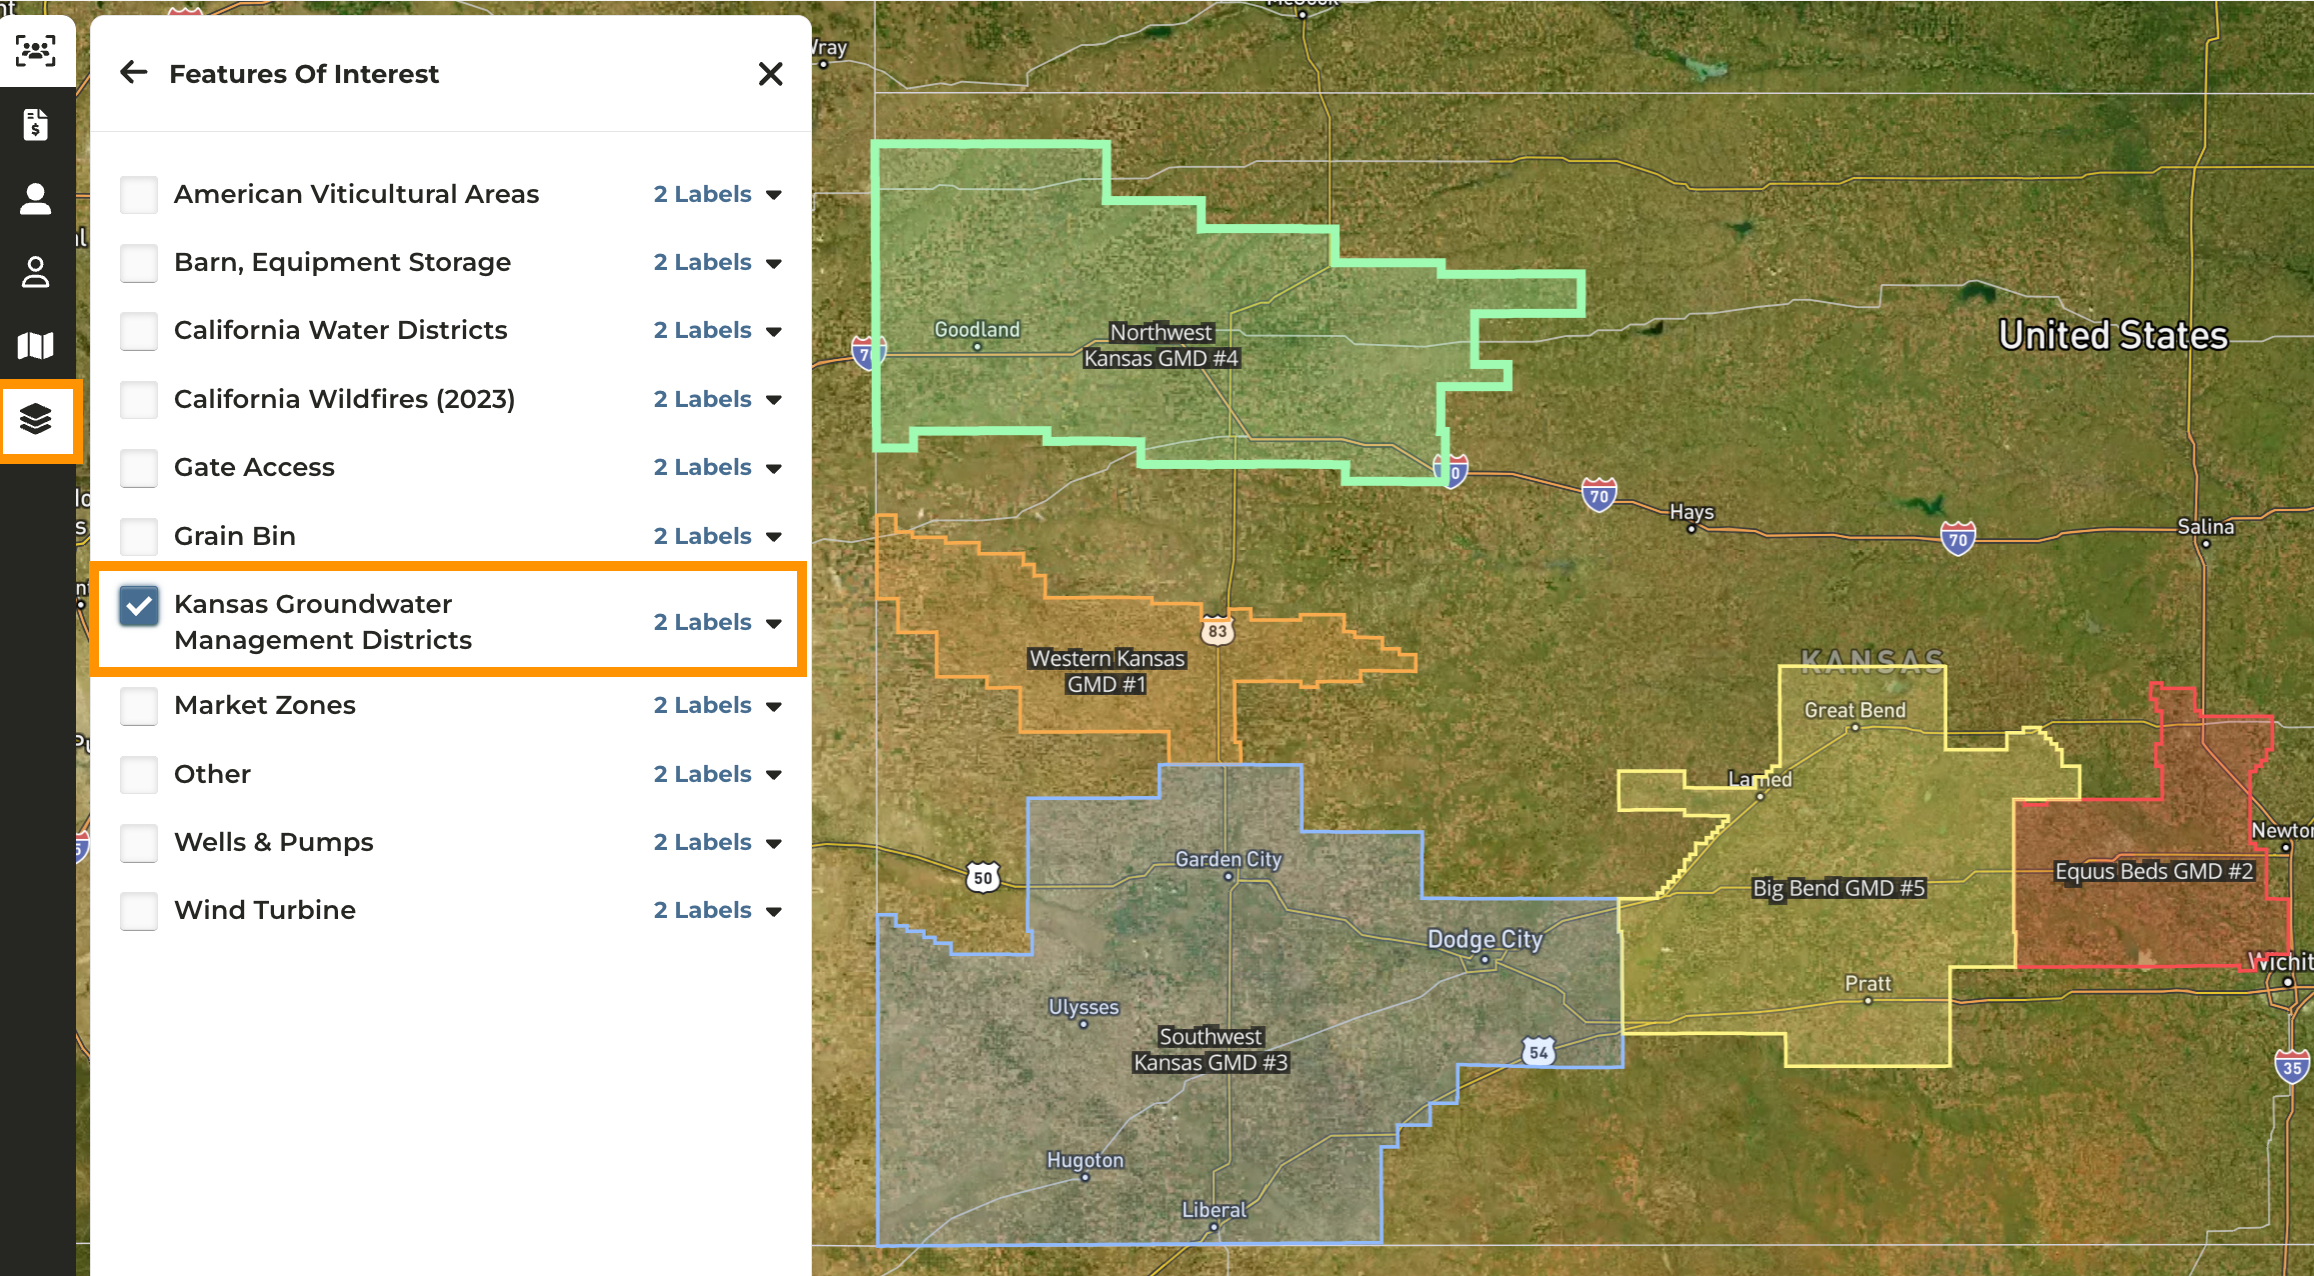
On the map, click on the specific area for which you'd like to generate a report
Within the pane on the left side of your screen, expand **Available Reports**
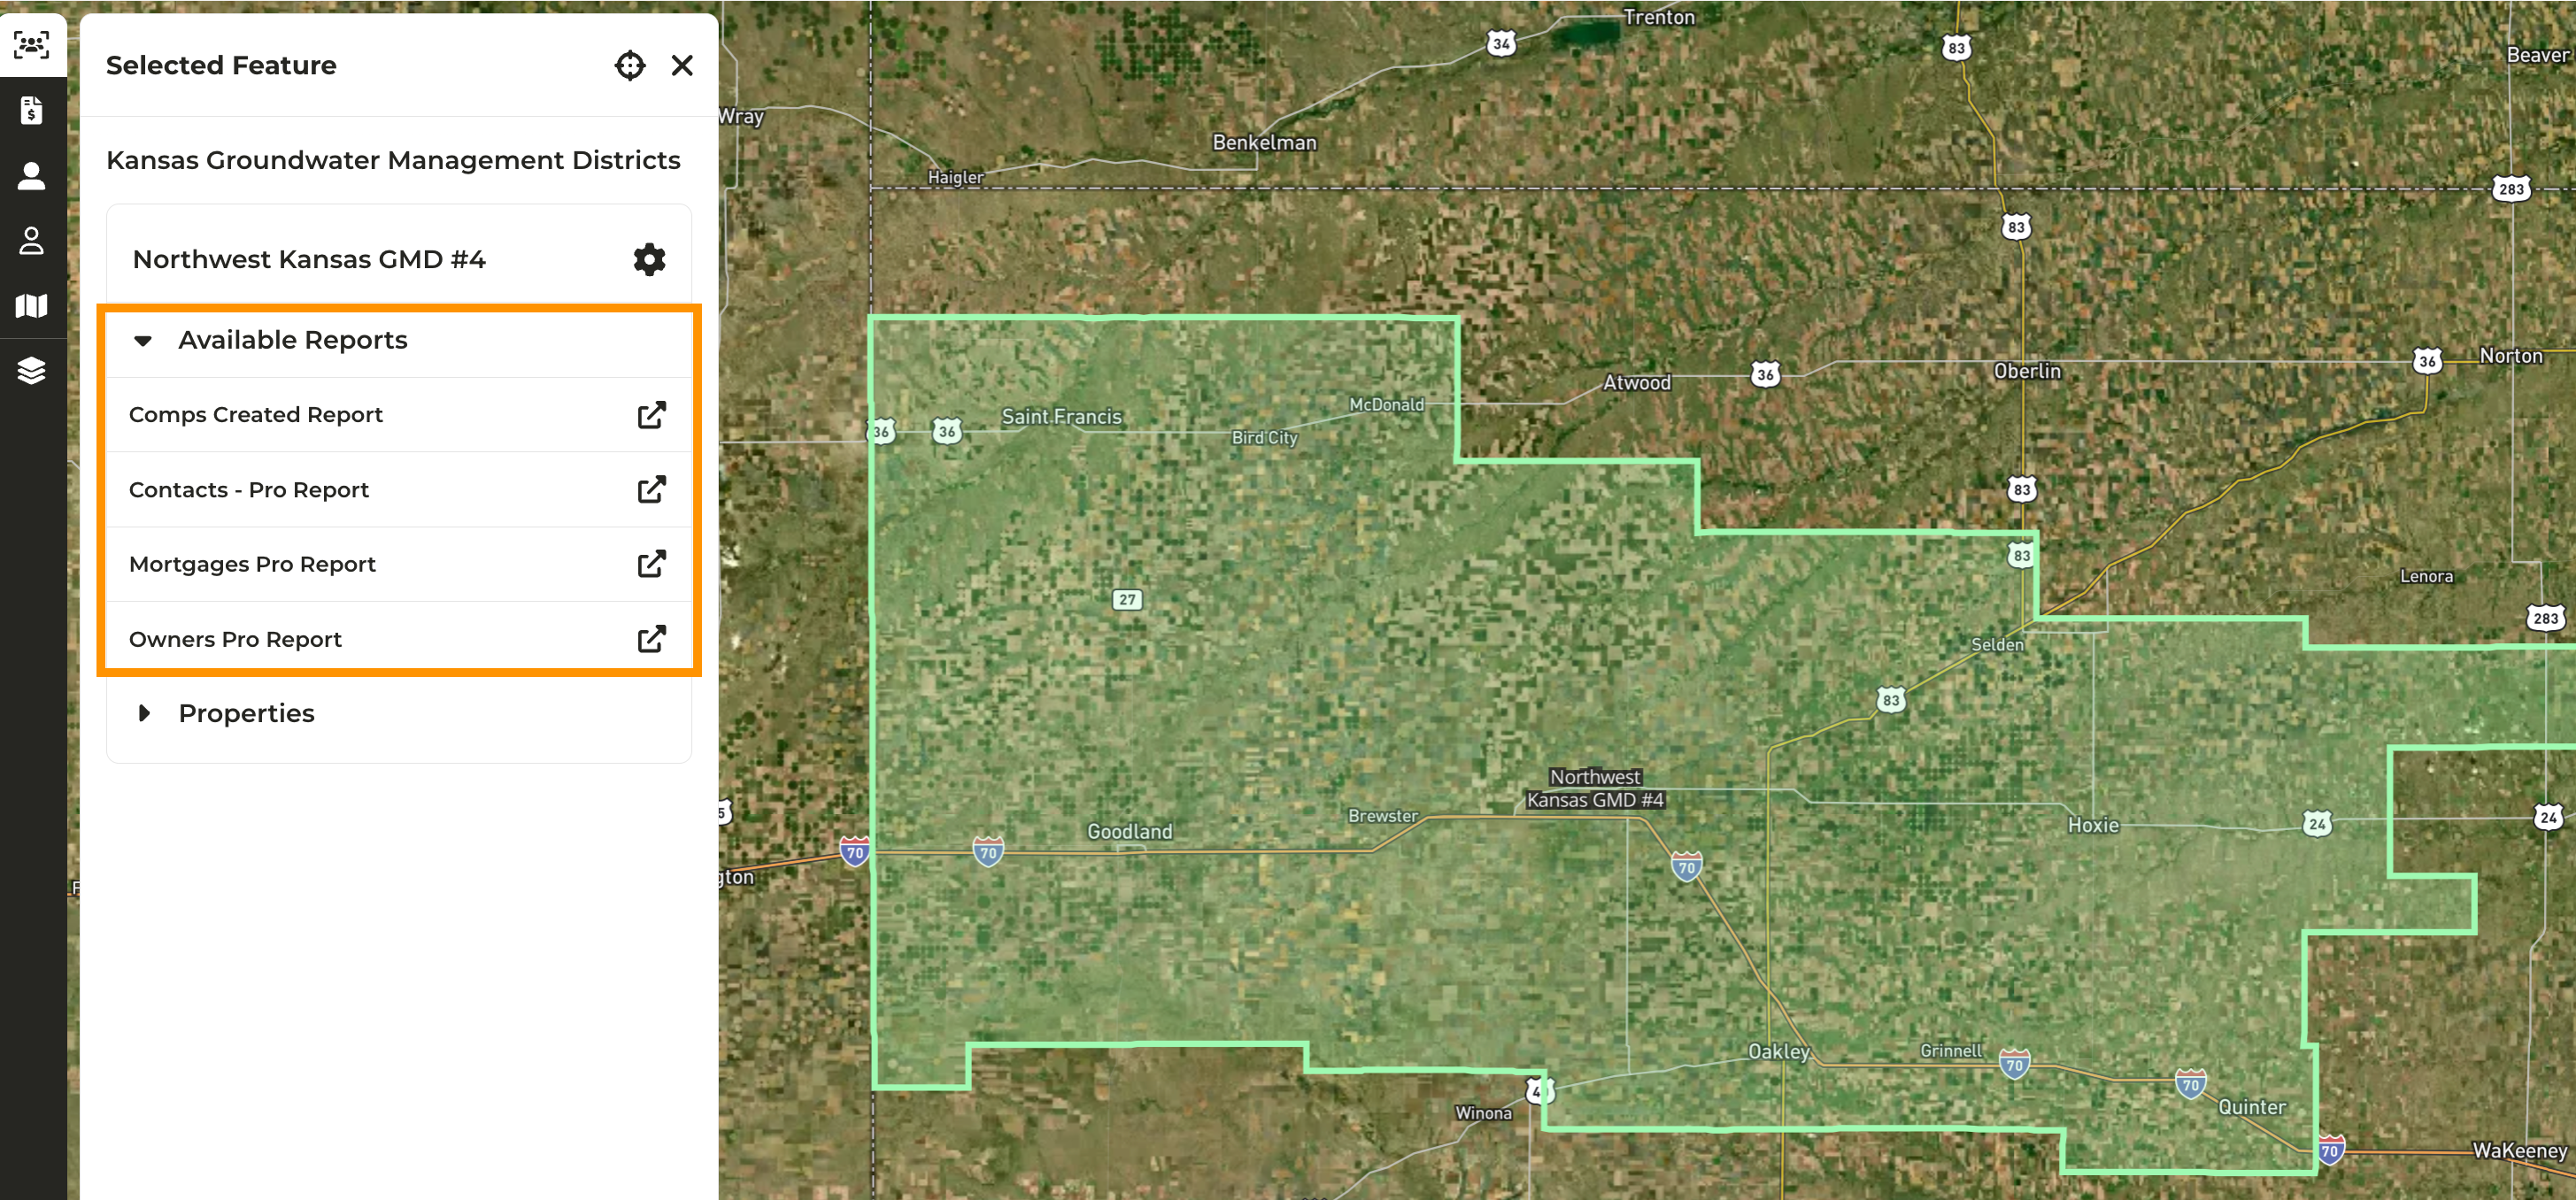
Click on the report you want to run
A new tab will open and the report will generate based on the area selected